Tuesday 11 October 2011

EXPERIMENT 2: The Analytics Engine 
Week 05- First draft of my Analytics Engine & Review


In this flowgraph I have successfully been able to link the rotation of the shutters to a key being pressed. As you can see when the np_7 key is pressed, three seconds later shutters move to 180 degrees which is 90 degrees from their original rotation position of 90 degrees. As the shutters only move on one axis I have realised if they have been rotated before being placed in the static position, this becomes their starting rotation angle. 

For example if the starting rotation angle is 90 degrees and the shutter is flat, then to make the shutter move vertically open, 180 degrees needs to be written in the x axis, even though its only moves 90 degrees. This has been aided by the help I have received from my tutor. I think this could definitely be developed. This has been aided by the help I have received from my tutor. I think this could definitely be developed into a more complex flow graph where different angles could directly correlate to xml data.  

As the shutters only move on one axis I have realised if they have been rotated before being placed in the static position, this becomes their starting rotation angle. For example if the starting rotation angle is 90 degrees and the shutter is flat, then to make the shutter move to be vertically open 180 degrees needs to be written in the x axis. HUD messages have also been linked so that all changing data can be represented in relation to the changing angle. This has been aided by the help I have received from my tutor. I think this could definitely be developed into a great way to analyse data. My analytics engine from this point is slowly progressing. 


Tuesday 4 October 2011

EXPERIMENT 2: The Analytics Engine 
Week 03- Final Brief for Analytics Engine (Change of Concept from previous) 

The Brief

Like a floating cosmos in the ocean Life Rafts could be situated anywhere in the worlds vast open waters. Imagine an oversized structure where boats and their stranded passengers can rest, recover, seek safety and shelter. They can simply park their boats, get out and can walk around. A helicopter landing pad is located on its roof as well as 30 rotating shutters which relate to light intensity data. Its slightly see-through multi-coloured façade also lights up in relation to this data like a diamond in the ocean attracting travellers like a lighthouse, only difference is when theres no land in sight for miles.      


EXPERIMENT 2: The Analytics Engine 
Week 03- Demonstration
EXPERIMENT 2: The Analytics Engine 
Week 03- Tasks 

Draft Brief

After consulting my tutor Vinh Nguyen I have developed these two main ideas for my EXP2 Analytics Engine.My Analytics Engine for EXP 2 is looking at Light Intensity and its impact on a space (entity). I wish to represent this information from my given Pachube feed. This will be done through an instillation that is submerged below ground level completely controlled by rotating shutters on the roof façade. 

In order to convey this concept i will need to link/embed flowgraphs in objects, spaces, vehicles and players. My main instillation wil be custom designed and built in SketchUp.
Overall I am mainly veering towards proposition 2 as it is a more challenging concept that showing my skills and knowledge in the Crysis Sandbox Editor. It also has a strong link to my chosen Pachube feed analysing its data in a unique way.   

Proposition 1

Rather than a front façade the entire subfloor is dependent on the angle of the roof shutters. The higher the value from the XML the lower the light levels.  When light levels are low, shutters are open so that the little light in the environment can enter the space. On the other hand when the light intensity is high shutters are closed, or at 45 degrees. Overall Light intensity will need to be representation in the following rotation spectrum.  0 (Closed Morning) 45 (East face open) 90 ( straight up) 135 ( West face open) 180 (closed Night). 

Proposition 2
 
This is one idea that might slightly change. I could also link light intensity to the height of the spaces below for example a high light intensity will bring sub floor structures closer to the surface maximising light that they can absorb. Low light intensity on the other hand will spaces height decrease as they don’t need to be subject to as much light. The shutters can then be rotated due to the time of day and position of the sun, where various lights and shadows are casted on the spaces below.

My Analytics Engine


How my Analytics Engine will allow a viewer to draw conclusions that would be difficult (or impossible) to reach by interrogating the data in raw form.

As a person engages with the instillation and environment they can see data being translated in real time to the positioning/growth of certain entities. Overtime (One day) they can see a 3D model change subject to light intensity.Conclusions are then able to be made as this rare form of data representation (through an active 3D Model) is expressed. This data alone however would be impossible to understand in its raw form (without the 3D model)

EXPERIMENT 2: The Analytics Engine 
Week 03- INDEPENDENT STUDY  
Infographics 
1. Map of the Internet


This inforgraph is a layout of all the networks that are interconnected to form the internet. Some are run by small and large ISPs, university networks, and customer networks - such as Facebook and Google. It’s visual representation of all those networks interconnecting with one another, forming the internet as we know it. Based on the size of the nodes and the thickness of the lines, it speaks to the size of those particular providers and the connections. 


 2. Visualizing Daily Activities With Media Wheel


This inforgraph illustrates how people in a particular segment engage with different media.The wheel visualizes how people consumer different types of media over the course of a day. For example, DVD/Video is mostly consumed in the evening and Newspaper is mostly consumed in the morning. each slice is a different type of media, and the consumption levels are shown by how bright the colors are at that time of day.

3. The Ride of Your Life 


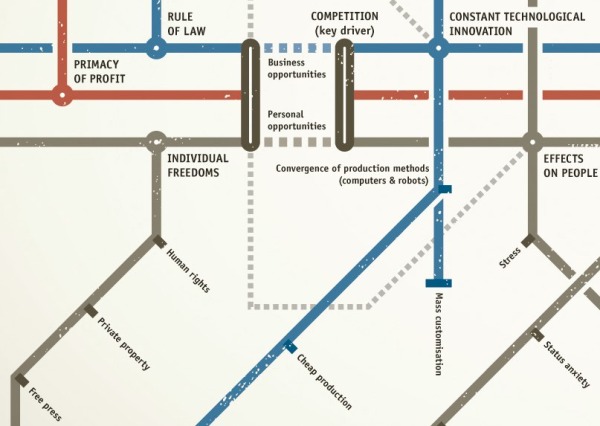
The Ride of Your Life is a very cool, interesting infographic using the subway map design style to show the potential dark side of capitalism. As a reader, you really need to look closely, and appreciate the level of detail and connections included in this design. The creator intrigued by the fact that people in liberal capitalist societies tend to feel less happy than in many others with significantly less wealth. This made him think of the role of persuasion industries. The overall message is that the dark side of Capitalism “can” lead to Misery, and the branches explore different aspects of business and personal life influences.


EXPERIMENT 2: The Analytics Engine 
Week 02- Tasks 

The flowgraph once activated by pressing 9 on the number pad records the position of the local player in relation to an entity in the Sandbox environment. A length integer is displayed on screen. The closer you are the smaller the number as it increases the more distant you are from the entity. This information is tracked in an external XML document, updated in real time as the character moves around the map. The Jet plane in my video is entity that the flowgraph data is based around. Through this tutorial I have been able to analyse movement in a new way that I never though was possible in Crysis.

My Version of the flowgraph
Part 01
Part 02


EXPERIMENT 2: The Analytics Engine Week 02- Tasks - INDEPENDENT STUDY  
RESEARCH


Adding AI - Flowgraph Tutorial & Basics

Flowgraph - Tips & Tricks


Advanced Camera Movement and Editing
EXPERIMENT 2: The Analytics Engine 
Week 01- Studio Tasks 

In this first experiment I am analysing, velocity of a vehicle (data collection) and its impact on a moving entity.  


The Flowgraph below analyses a moving entity. With some help from Russell during the tutorial I have successfully been able to complete this custom flow graph.  This is done by recording the velocity of the vehicle in m/sec through a flowgraph. This information is displayed as a HUD message on screen and can be used to determine various other aspects of the moving vehicle such as average top speed over a specific distance. The information is then passed on to make an entity move. The ramp entity in this case  rises to a specific height when the vehicle reaches a speed over 10 m/sec and descends once the vehicle is below this velocity as it is only safe to hit the ramp at this speed in order to clear the concrete barrier behind it. Therefore if the vehicle does not reach a minimum speed of 10m/sec it will crash into the concrete barrier behind. 

Nodes used include:
Physics: Dynamics  
Vec3:MagnitudeVec3  
Math: Less  
Movement: MoveEntityTo  
HUD: Show HUD Message


EXPERIMENT 2: The Analytics Engine Week 01- Tasks - INDEPENDENT STUDY
Chosen Pachube Feed | Arduino Light Sensor Feed

This feed displays light input data ranging from 0 to 1023, as collected by a light dependent resistor within an Arduino scheme. A high value currently represents low light intensity, and a low value represents high intensity.These values are translated into an angle value from 0 to 90 degrees which informs the rotation of one or more servos. These servos power circular shutters which block circular openings in a facade system during periods of high daylight intensity, and un-block the openings during periods of low intensity. In this way, the facade is able to maintain soft natural internal lighting at all times.


Idea: 

Image Source
S.W.O.T analysis 

Strengths
Weaknesses
Light is continually updated and can be represented in many ways through the Crysis sandbox 2 editor.

The light flow measured does not encounter obstructions from buildings and their shadows as the sensor is positioned in an area where direct sunlight hits the most.  

The feed has not yet been updated and remains frozen.

The environment of the sensor remains unclear for example, sun direction (east or west) and compass facing of the window.

  
Opportunities
Threats
Light flow has always been a data form that interest me. Through Crysis’s time of day capabilities representing a virtual world in real time, and the flow of light through various instillations will provide a strong basis of research and analysis.
Complex Flow graphs and models may need to be created in order to effectively represent my chosen Pachube Feed.

Who knows if the sensor will display correct information on a regular basis